1. Derivative Report
India Research
April 27, 2010
Comments
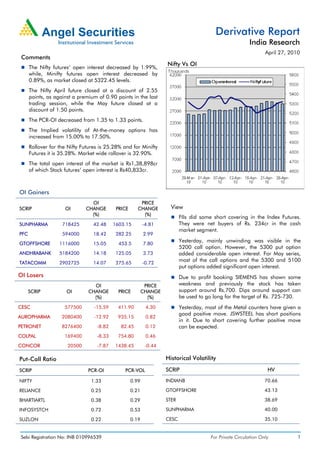
Nifty Vs OI
The Nifty futures’ open interest decreased by 1.99%,
while, Minifty futures open interest decreased by
0.89%, as market closed at 5322.45 levels.
The Nifty April future closed at a discount of 2.55
points, as against a premium of 0.90 points in the last
trading session, while the May future closed at a
discount of 1.50 points.
The PCR-OI decreased from 1.35 to 1.33 points.
The Implied volatility of At-the-money options has
increased from 15.00% to 17.50%.
Rollover for the Nifty Futures is 25.28% and for Minifty
Futures it is 35.28%. Market wide rollover is 32.90%.
The total open interest of the market is Rs1,38,898cr
of which Stock futures’ open interest is Rs40,833cr.
OI Gainers
OI PRICE
SCRIP OI CHANGE PRICE CHANGE View
(%) (%)
FIIs did some short covering in the Index Futures.
SUNPHARMA 718425 42.48 1603.15 -4.81 They were net buyers of Rs. 234cr in the cash
market segment.
PFC 594000 18.42 282.25 2.99
Yesterday, mainly unwinding was visible in the
GTOFFSHORE 1116000 15.05 453.5 7.80
5200 call option. However, the 5300 put option
ANDHRABANK 5184200 14.18 125.05 3.73 added considerable open interest. For May series,
TATACOMM 2902725 14.07 275.65 -0.72
most of the call options and the 5300 and 5100
put options added significant open interest.
OI Losers Due to profit booking SIEMENS has shown some
OI PRICE weakness and previously the stock has taken
SCRIP OI CHANGE PRICE CHANGE support around Rs.700. Dips around support can
(%) (%) be used to go long for the target of Rs. 725-730.
CESC 577500 -15.59 411.90 4.30 Yesterday, most of the Metal counters have given a
good positive move. JSWSTEEL has short positions
AUROPHARMA 2080400 -12.92 935.15 0.82
in it. Due to short covering further positive move
PETRONET 8276400 -8.82 82.45 0.12 can be expected.
COLPAL 169400 -8.33 754.80 0.46
CONCOR 20500 -7.87 1438.45 -0.44
Put-Call Ratio Historical Volatility
SCRIP PCR-OI PCR-VOL SCRIP HV
NIFTY 1.33 0.99 INDIANB 70.66
RELIANCE 0.25 0.21 GTOFFSHORE 43.13
BHARTIARTL 0.38 0.29 STER 38.69
INFOSYSTCH 0.72 0.53 SUNPHARMA 40.00
SUZLON 0.22 0.19 CESC 35.10
Sebi Registration No: INB 010996539 For Private Circulation Only 1
2. Derivative Report | India Research
FII Statistics for 26-April-2010 Turnover on 26-April-2010
Open Interest
No. of Turnover Change
Detail Buy Sell Net Instrument
Contracts (Rs. in cr.) (%)
Contracts Value Change
(Rs. in cr.) (%)
INDEX Index Futures 421027 11253.83 -29.16
3244.72 3092.46 152.25 529928 14294.84 -2.92
FUTURES
INDEX Stock Futures 766821 26504.11 18.61
2328.04 2128.02 200.02 1681349 44781.67 1.76
OPTIONS
STOCK Index Options 1522109 40532.59 -31.77
6203.54 6172.46 31.08 998952 33138.24 2.00
FUTURES
STOCK Stock Options 97637 3903.34 -18.93
397.15 414.36 (17.21) 35849 1189.35 -0.69
OPTIONS
TOTAL 12173.44 11807.30 366.14 3246078 93404.11 1.01 Total 2807594 82193.87 -19.77
Nifty Spot = 5322.45 Lot Size = 50
Bull-Call Spreads Bear-Put Spreads
Action Strike Price Risk Reward BEP Action Strike Price Risk Reward BEP
Buy 5300 44.10 Buy 5200 7.15
37.05 62.95 5337.05 4.55 95.45 5195.45
Sell 5400 7.05 Sell 5100 2.60
Buy 5300 44.10 Buy 5200 7.15
43.45 156.55 5343.45 5.95 194.05 5194.05
Sell 5500 0.65 Sell 5000 1.20
Buy 5400 7.05 Buy 5100 2.60
6.40 93.60 5406.40 1.40 98.60 5098.60
Sell 5500 0.65 Sell 5000 1.20
Note: Above mentioned Bullish or Bearish Spreads in Nifty (April Series) are given as an information and not as a recommendation
Nifty Put-Call Analysis
For Private Circulation Only Sebi Registration No: INB 010996539 2
3. Derivative Report | India Research
Strategy Date Scrip Strategy Status
29-March-2010 SUZLON Long Call Continue
29-March-2010 IDBI Long Call Profit Booked on 06-Apr-2010
05-April-2010 RNRL Long Call Continue
05-April-2010 HUL Long Put Profit Booked on 08-Apr-2010
12-April-2010 JPASSOCIAT Ratio Call Spread Continue
19-April-2010 BHARTIARTL Long Call Did not trigger
26-April-2010 CAIRN Long Call Did not trigger
26-April-2010 PUNJLLYOD Long Call Continue
DISCLAIMER:
This document is not for public distribution and has been furnished to you solely for your information and must not be reproduced or redistributed to any other person.
Persons into whose possession this document may come are required to observe these restrictions.
Opinion expressed is our current opinion as of the date appearing on this material only. While we endeavor to update on a reasonable basis the information discussed in
this material, there may be regulatory, compliance, or other reasons that prevent us from doing so. Prospective investors and others are cautioned that any forward-
looking statements are not predictions and may be subject to change without notice. Our proprietary trading and investment businesses may make investment decisions
that are inconsistent with the recommendations expressed herein.
The information in this document has been printed on the basis of publicly available information, internal data and other reliable sources believed to be true and are for
general guidance only. While every effort is made to ensure the accuracy and completeness of information contained, the company takes no guarantee and assumes no
liability for any errors or omissions of the information. No one can use the information as the basis for any claim, demand or cause of action.
Recipients of this material should rely on their own investigations and take their own professional advice. Each recipient of this document should make such investigations
as it deems necessary to arrive at an independent evaluation of an investment in the securities of companies referred to in this document (including the merits and risks
involved), and should consult their own advisors to determine the merits and risks of such an investment. Price and value of the investments referred to in this material may
go up or down. Past performance is not a guide for future performance.
Certain transactions - futures, options and other derivatives as well as non-investment grade securities - involve substantial risks and are not suitable for all investors.
Reports based on technical analysis centers on studying charts of a stock's price movement and trading volume, as opposed to focusing on a company's fundamentals and
as such, may not match with a report on a company's fundamentals.
We do not undertake to advise you as to any change of our views expressed in this document. While we would endeavor to update the information herein on a reasonable
basis, Angel Broking, its subsidiaries and associated companies, their directors and employees are under no obligation to update or keep the information current. Also
there may be regulatory, compliance, or other reasons that may prevent Angel Broking and affiliates from doing so. Prospective investors and others are cautioned that
any forward-looking statements are not predictions and may be subject to change without notice.
Angel Broking Limited and affiliates, including the analyst who has issued this report, may, on the date of this report, and from time to time, have long or short positions
in, and buy or sell the securities of the companies mentioned herein or engage in any other transaction involving such securities and earn brokerage or compensation or
act as advisor or have other potential conflict of interest with respect to company/ies mentioned herein or inconsistent with any recommendation and related information
and opinions.
Angel Broking Limited and affiliates may seek to provide or have engaged in providing corporate finance, investment banking or other advisory services in a merger or
specific transaction to the companies referred to in this report, as on the date of this report or in the past.
Sebi Registration No.: INB 010996539
Derivative Research Team derivatives.desk@angeltrade.com
For Private Circulation Only Sebi Registration No: INB 010996539 3